
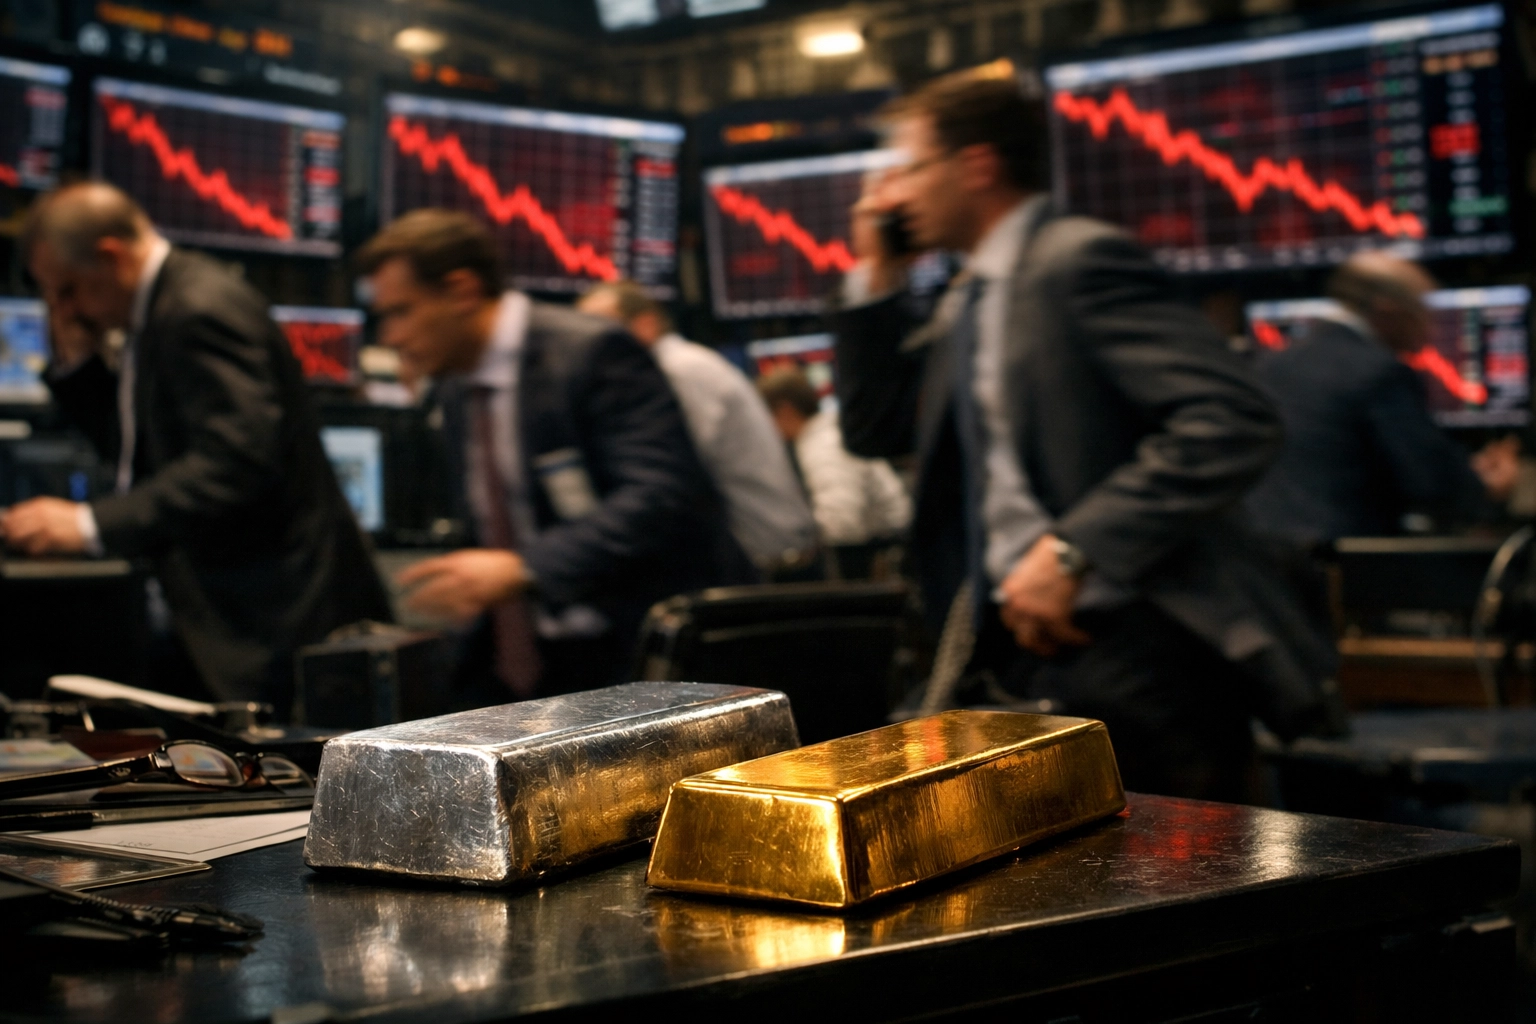
Gold and silver markets are flashing warning signs despite: or perhaps because of: their historic rally into record territory. As of January 30, 2026, precious metals are experiencing extreme price swings that have prompted analysts to question whether traditional market mechanics are functioning properly.
The debate centers on a paradox: gold and silver prices continue pushing toward all-time highs even as traditional bearish signals: including a surging U.S. dollar and new tariff announcements: would typically pressure these assets lower. For retail investors who view gold as portfolio insurance, the current environment raises a critical question: Is this a sustainable bull market, or something more fragile?
The Violent Swings Behind the Rally
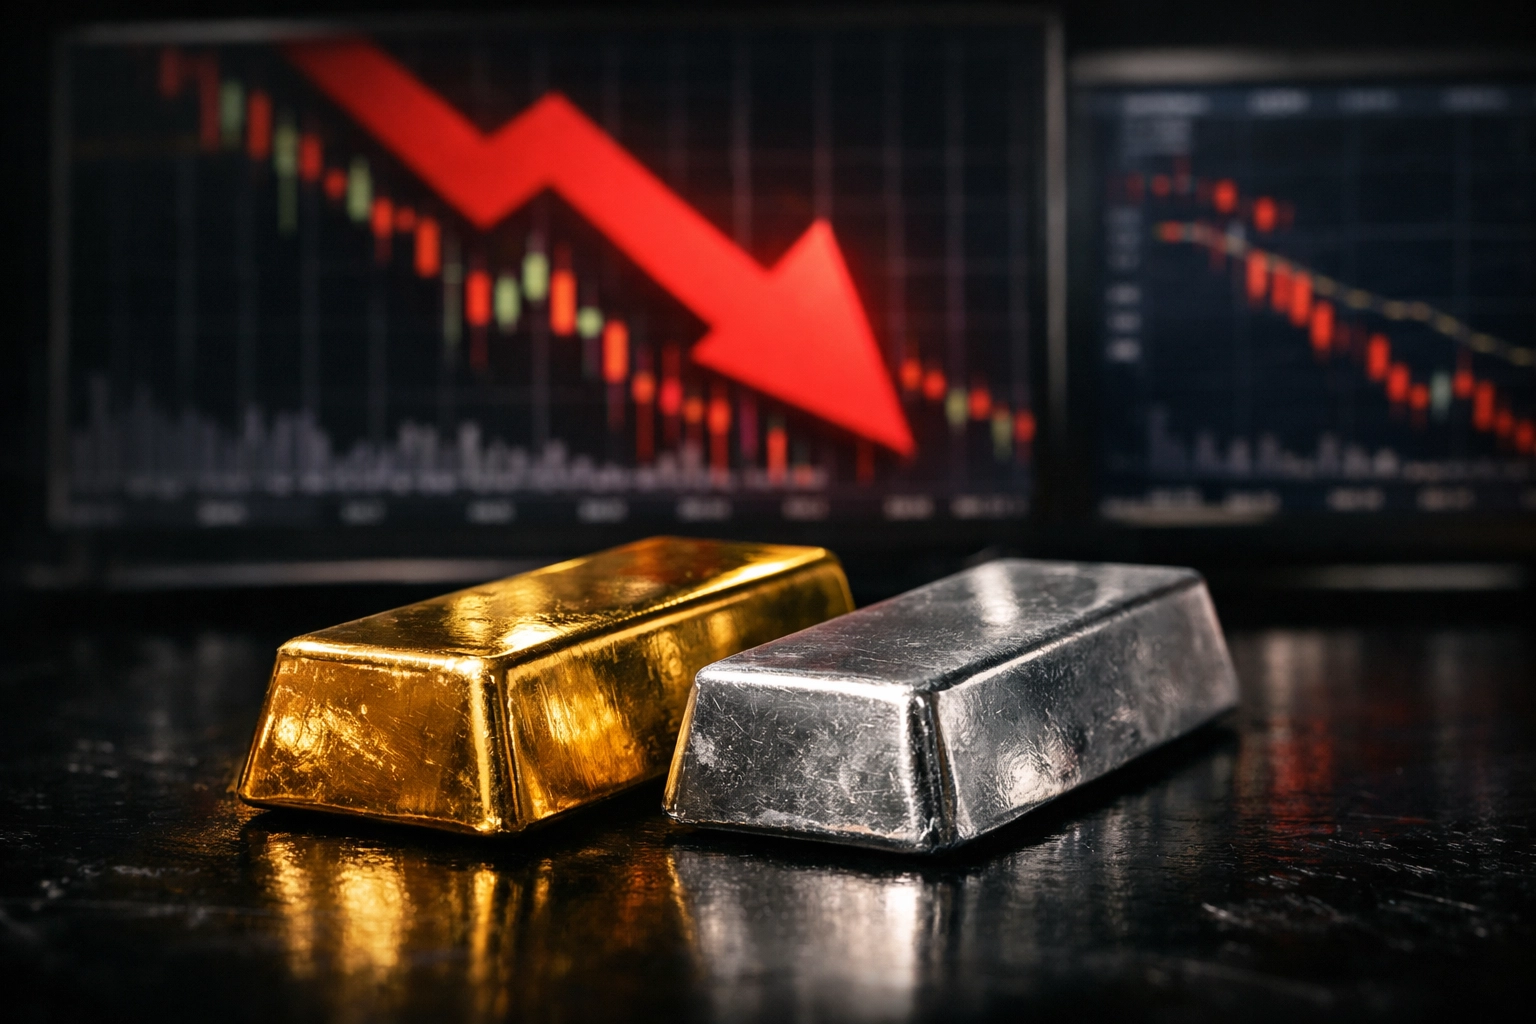
Gold crashed roughly 8% on Thursday, sliding from a recent peak near $5,600 per ounce to around $5,150. Silver experienced an even sharper decline, plunging about 30% to around $98 per ounce from a recent peak of $121. Both declines occurred during a broader tech stock selloff, suggesting contagion across risk assets rather than isolated precious metals weakness.
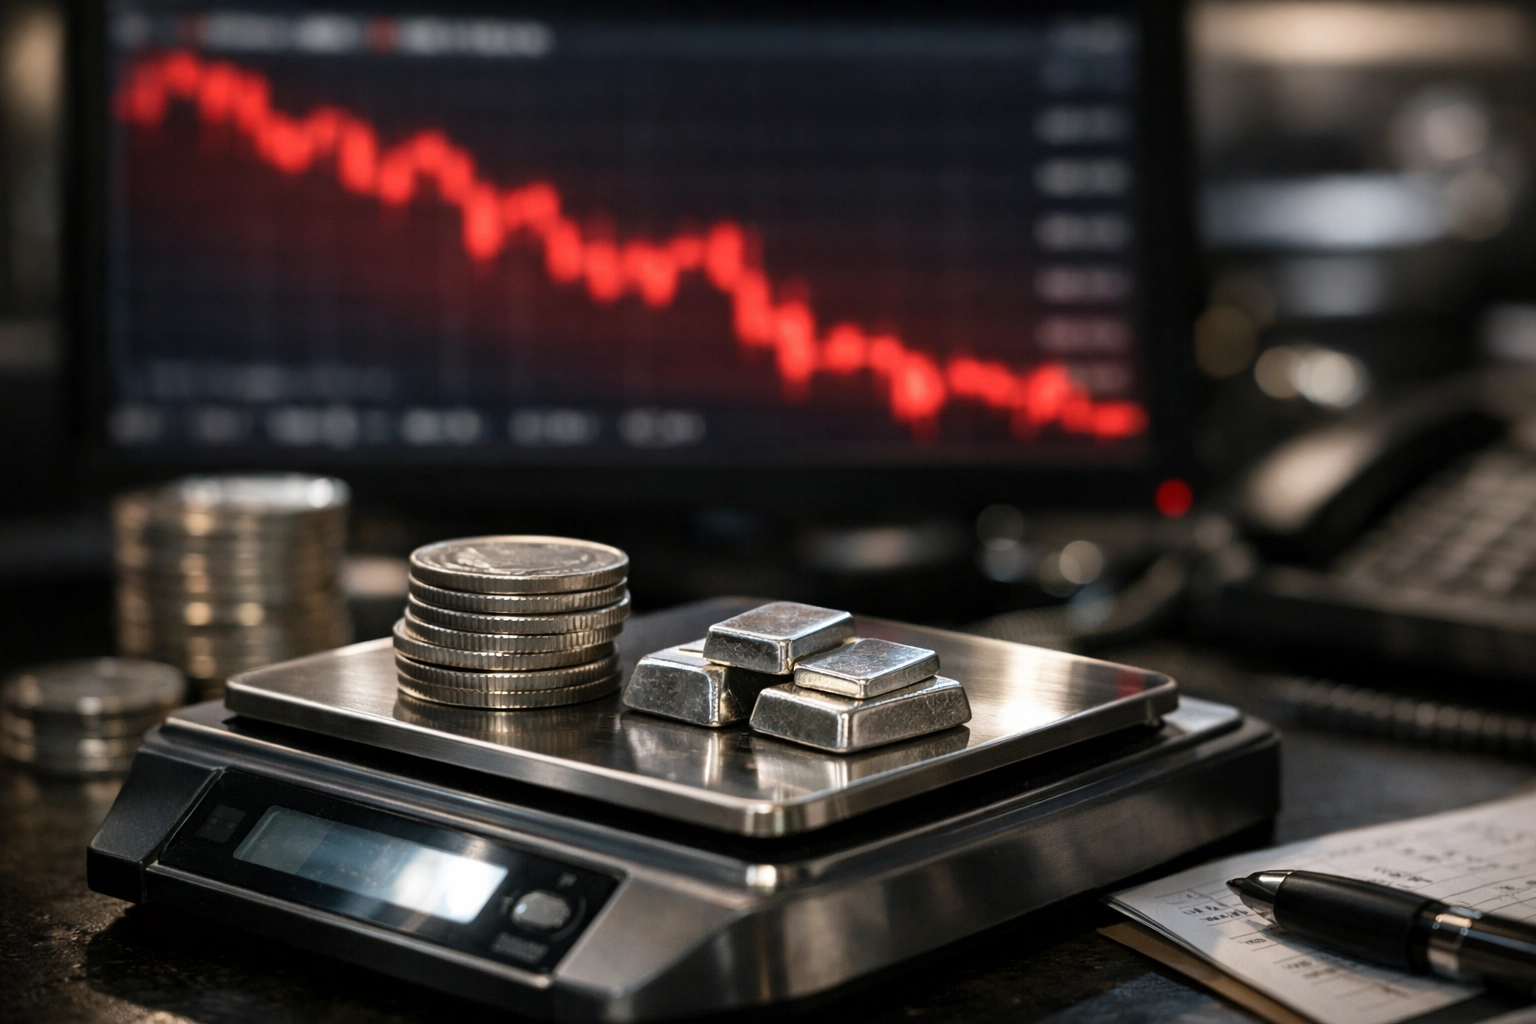
The speed and magnitude of these moves stand out. Gold's 55% gain throughout 2025 represented one of the strongest annual performances in decades. Silver posted its best monthly return outside of December 1979, when the Hunt brothers' attempt to corner the market sent prices parabolic. But the recent pullbacks happened in hours, not weeks.
Ole Hansen, a commodities analyst at Saxo Bank, identified the core problem: "The problem is volatility feeding on itself. As price swings intensify, liquidity thins. Banks and market makers struggle to manage risk. When their willingness to quote prices in size fades, liquidity deteriorates and volatility blows out."
Why Liquidity is Breaking Down
The "broken" market narrative stems from structural issues in how precious metals trade, not fundamental demand collapse. According to Simon Biddle, head of precious metals at broker Tullet Prebon, "banks don't have infinite balance sheets to trade precious metals" and "trading volumes have decreased as they are taking less risk."
This liquidity squeeze manifests in measurable ways. Silver ETF volumes retreated from record levels seen earlier in the week. Comex silver futures volume fell for a second consecutive day. While gold futures trading volumes remained elevated, the bid-ask spreads: the gap between buying and selling prices: widened significantly during volatile sessions.
Market makers, the firms that provide liquidity by continuously quoting buy and sell prices, face a dilemma. Extreme volatility increases their risk exposure. When gold can move $500 in a single session, a market maker holding inventory faces potential losses that exceed their typical profit margins. The rational response is to step back, which paradoxically makes the volatility worse.
This differs from typical supply-demand imbalances. Physical gold and silver demand remains strong. Central banks continue accumulating gold reserves. Retail investors are buying physical bullion and ETFs. But the financial plumbing that connects buyers and sellers is under stress.
The Dollar and Tariff Paradox
Precious metals are traditionally inversely correlated with the U.S. dollar. When the dollar strengthens, gold and silver typically fall because they become more expensive for foreign buyers. Yet gold and silver hit new highs even as the dollar posted its best weekly performance in months.
The recent 25% tariff announcements on imports from Mexico and Canada, plus a 10% tariff on Chinese goods, would normally support the dollar and pressure commodities. These tariffs increase the relative attractiveness of U.S. assets and raise concerns about global trade flows: both dollar-positive, gold-negative factors.
The persistent strength in precious metals despite dollar gains suggests investors are pricing in risks that transcend traditional currency dynamics. Tariff-driven inflation concerns may be overriding the typical dollar correlation. If tariffs push consumer prices higher while economic growth slows, the stagflationary outcome historically favors gold.
According to market participants, the gold price outlook increasingly reflects geopolitical risk premium and monetary policy uncertainty rather than simply tracking real interest rates or currency movements. This decoupling from traditional drivers is what prompts some analysts to describe the market as "broken": meaning the usual playbook no longer applies.
What It Means for Retail Investors
For investors considering gold and silver exposure, the current environment presents both opportunity and danger. The extreme volatility creates entry points for those willing to stomach sharp drawdowns. Thursday's $500 gold crash, for example, reversed partly by Friday's session: but not before triggering stop-loss orders for leveraged traders.
Physical bullion buyers face a different calculation than futures traders or ETF holders. Physical premiums: the markup over spot prices that dealers charge: have remained relatively stable despite paper market volatility. This suggests the retail physical market is functioning normally even as financial markets experience stress.
J.P. Morgan's forecast provides a longer-term anchor. The firm has revised its 2026 gold forecast upward to between $8,000 and $8,500 per ounce, driven by central bank purchases around 755 tonnes and sustained investor demand through ETFs and physical bullion. This forecast was issued before this week's volatility, suggesting the bank views recent swings as noise rather than trend change.
The practical question for portfolio allocation: Should investors wait for volatility to subside, or use pullbacks as buying opportunities? The answer depends partly on investment horizon. Short-term traders face elevated risk from liquidity gaps and momentum reversals. Longer-term holders focused on inflation protection or portfolio diversification may view current prices as acceptable entry points, especially if they believe the fundamental drivers remain intact.
The Case for and Against "Broken" Markets
The "broken market" thesis rests on observable dysfunction: extreme intraday swings, widening bid-ask spreads, declining market maker participation, and price action that defies traditional correlations. These are real phenomena with measurable impacts on trading costs and execution quality.
The counter-argument points to sustained underlying demand. Central banks aren't selling. ETF inflows continue. Physical premiums remain firm. From this perspective, the market isn't broken: it's adjusting to a new regime where geopolitical uncertainty and monetary policy distrust outweigh traditional valuation metrics.
Hansen's "volatility feeding on itself" diagnosis suggests a middle ground. The market may function properly in terms of matching buyers and sellers, but the feedback loop between price swings and liquidity withdrawal creates temporary dislocations that feel like dysfunction.
For investors, this distinction matters less than the practical reality: precious metals currently trade with equity-like volatility but without the same depth of market making infrastructure. A position sized appropriately for historical gold volatility may be dangerously large given current conditions.
Looking Ahead: Sustainability or Bubble?
The sustainability of current price levels depends on whether the factors driving demand: central bank accumulation, inflation hedging, geopolitical risk: persist or fade. If central banks continue diversifying away from dollar reserves, the 755-tonne annual purchase forecast could prove conservative. If tariffs spark a trade war that undermines global growth, the safe-haven bid may intensify.
Conversely, if the Federal Reserve maintains its current policy stance and inflation expectations remain anchored, the urgency to own gold as inflation protection diminishes. If geopolitical tensions ease, risk premiums compress.
The record highs themselves don't necessarily signal a bubble. Gold reached previous all-time highs in 2011, then traded sideways for years before eventually pushing higher. Silver's 1980 peak wasn't revisited for decades. Whether current prices represent fair value or overextension depends on forward-looking risk assessments, not historical price comparisons.
What is clear: the gold price outlook for 2026 will be shaped as much by market structure and liquidity conditions as by fundamental supply-demand dynamics. Investors accustomed to viewing precious metals as stable, low-volatility portfolio anchors are confronting a new reality where daily swings rival those of growth stocks. Whether that represents a broken market or simply a recalibration is a debate that will likely persist as long as the volatility does.