
Investing in today’s market can be akin to sailing in stormy waters, especially in a post-pandemic world where market volatility has become a staple. The uncertainty surrounding when to make a move – to buy or sell a stock – is a common dilemma. However, technical analysis, a method that studies chart patterns of securities, can be a beacon for investors navigating these rough seas, aiding in more informed buying and selling decisions.
Technical analysis is a strategy that primarily focuses on a stock’s price and trading volume, as opposed to its fundamentals. Through this lens, investors can spot favorable entry points into a stock or identify when it might be wise to reduce exposure to a particular asset.
In the realm of technical analysis, a plethora of indicators are at an investor’s disposal. This guide will delve into a select few that are widely recognized and utilized:
- Breakouts
- Moving Averages
- Fibonacci Retracements
- Relative Strength Index (RSI)
- Volume
Let’s venture into each of these indicators and elucidate how they can be instrumental in refining your investment strategy.
Charting the Breakouts
Breakouts occur when a stock price moves beyond a defined resistance or support level. Such movement can herald the continuation of the stock’s trajectory in the direction of the breakout. For instance, consider an upside breakout in Netflix during late 2022.
Netflix shares danced between the $213 and $249 marks from late July to mid-October 2022. However, on October 18, 2022, the stock shattered the resistance level and soared higher.
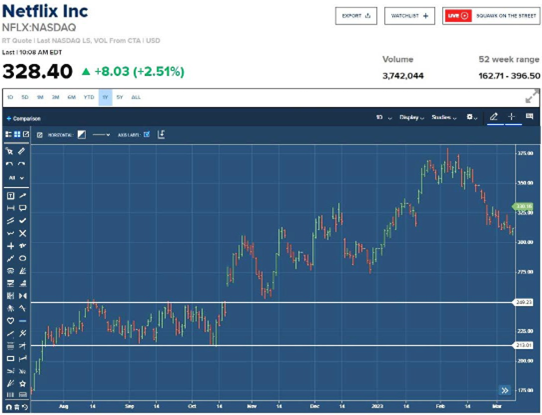
Identifying support and resistance levels is crucial to pinpointing potential breakouts. These levels often mirror price points where traders have historically bought or sold shares successfully, or where preset trades are triggered. When Netflix ascended past the $249 mark, a ripple ran through the trading community, likely prompting some to purchase more shares, thereby propelling the breakout further.
It’s essential to note that interpreting these levels is not an exact science and may vary among traders. Nonetheless, these indicators can be invaluable in determining when to bolster your stock exposure or when to cash in on some gains.
Sailing with Moving Averages
Moving averages, another esteemed technical indicator, offer a glimpse into a stock’s average closing price over a specified period. Commonly used moving averages span 50, 100, and 200 days.
These indicators shine in providing clearer support and resistance levels, which can be exemplified by examining Exxon Mobil’s moving averages. The stock found support at its 200-day moving average in late September 2022, later surging past its 100-day and 50-day averages.
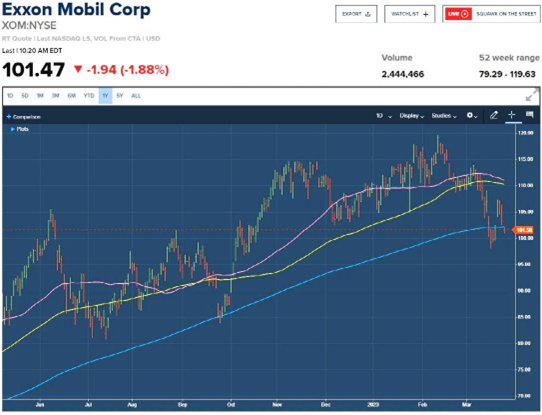
Besides, moving averages are adept at discerning short-, medium-, and long-term trends in securities. They are invaluable in understanding a stock’s performance trajectory over varying time frames.
Navigating with Fibonacci Retracements
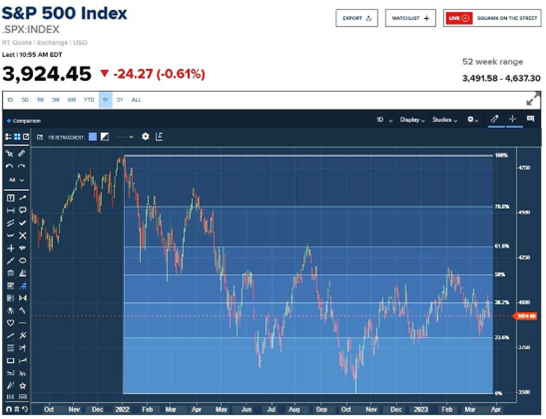
Fibonacci retracement levels, rooted in the mathematical genius of the Italian mathematician Fibonacci, can also augment an investor’s decision-making toolkit. These percentage lines outline potential support and resistance levels between two extreme points on a chart.
For instance, a chart encompassing the S&P 500’s performance from its zenith in January 2022 to the bear market nadir in October 2022 can be illustrative. After nosediving below several retracement levels, the S&P 500 found support around the 23.6% level in late 2022 and early 2023, although it later grappled with the 38.2% level after briefly touching the 50% mark.
Riding the Waves with Relative Strength Index (RSI)
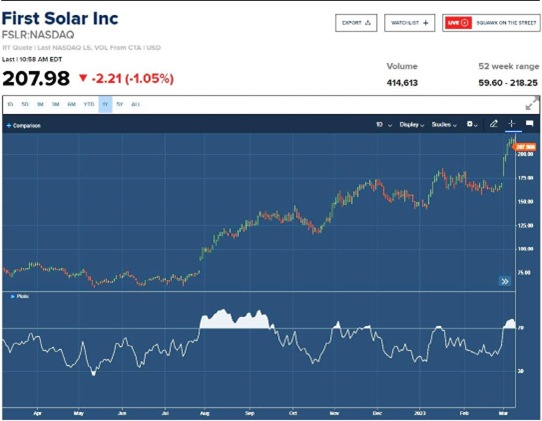
Keen on discerning if a stock is being heavily bought? The Relative Strength Index (RSI) can be your compass. By measuring the speed and magnitude of a security’s price movements over a 14-day period, RSI helps investors ascertain whether a stock is overbought or oversold.
For instance, a one-year chart of First Solar indicates that it might be time for investors to trim their positions, as the RSI sits comfortably above 70, signaling an overbought scenario.
Treading the Waters of Trading Volume
Trading volume, reflecting the number of shares traded over a set period, is a robust tool for gauging a stock’s movements. For example, a sharp drop in MongoDB’s share price coupled with a significant volume spike could signal a potential trend shift.
Anchoring Your Strategy
While no technical indicator is infallible, they can significantly augment the decision-making arsenal of investors, even those with a fundamental analysis bent. The essence lies in discovering which indicators resonate with your investing ethos and employing them to navigate the capricious market waters.